Coursework: Overall equipment effectiveness (OEE)

Overall equipment effectiveness

Manufacturing a product is a difficult practice. Due to lack of metrics and plans, it is quite easy to lose direction and have the industry managed by the production. Overall equipment effectiveness (OEE) is a criterion that combines various manufacturing issues and figures to provide information concerning the progression. Through a predictable process of combining the essential data, OEE gives definite process information. All staff members can utilize the facts to comprehend the modern shape of the manufacturing process. By having a programed structure of the impact of machine accessibility, performance, and eminence, OEE provides an outline to trace fundamental issues and their origins. Moreover, OEE provides a structure for improvements in the manufacturing process (Mohammadi & Mehta 2011). This paper calculates the availability, performance, quality, and OEE of the company that manufactures radiators and heat exchangers. In addition, it will analyze losses using Pareto technique giving recommendations for improvements.

Question One

OEE takes into consideration three factors: availability, performance, and quality (Reyes 2010). It is calculated using the following formula:

OEE = Availability x Performance x Quality, where availability is the machine used for planned manufacture.

At the most crucial point of the process operation, worth for the ultimate user is created. When a process stops, it creates an expenditure with no linked charge. It can be explained by mechanical failure, operator issues, raw materials, and machine operation. Comparing planned run time to actual run time, the availability constituent of OEE allows to calculate the lost production due to downtime (Mohammadi & Mehta 2011).

Performance is calculated by the amount of waste produced through operation at less than most favorable speed. By comparing the real cycle time and perfect cycle time, it is possible to calculate the amount of production lost through cycles that did not attract the perfect cycle time (Reyes 2010). On the other hand, quality focuses on determining the time spent on production of a good that does not meet quality requirements. Through comparison of the amount of good to reject parts, the percent of the time truly adding value by producing a good product is exposed (Stamatis 2010).

Using the TD tube machine data, one can derive the following:

OEE = Availability * Performance * Quality

Availability = planned run-time – down-time/planned run-time

Planned run-time is 8 hours or 480 minutes (from 8 am to 4 pm, there are 8 hours multiplied by 60 minutes) per day from Monday to Friday.

Down time = minor stops + startup losses + breakdowns + reel changes + materials + breaks + set ups

Monday down time = 5 + 40 + 51 + 25 + 45 + 18 + 26 = 210

Tuesday down time = 5 + 66 + 21 + 40 + 20 +32 = 184

Wednesday down time = 60 + 29 + 50 + 14 + 19 = 172

Thursday down time = 1 + 48 + 16 + 30 + 20 + 29 = 14

Friday down time = 1 + 70 + 19 + 75 + 14 + 39 = 218

Good lengths = total lengths – rejected/bad lengths.

Monday total lengths = 1347 + 1283 + 1588 + 1588 + 1283 = 7089.

Monday bad lengths = 25 + 24 + 10 + 25 + 5 + 4 = 93

Tuesday total lengths = 1283 + 1588 + 1347 = 4218.

Tuesday bad lengths = 5+15+9+4+6+40+6+8 = 93

Wednesday total lengths = 1347=1588 = 2935.

Wednesday bad lengths = 35+20+10+6+22+10+15+20+6+15+20+10+6+25+15 = 235

Thursday total length = 1347+1941+1283+1347 = 5918.

Thursday bad lengths = 6+10+6+10+6+6+6+8+29 = 87

Friday total lengths = 1347+1588 = 2935.

Friday bad lengths = 40+15+6+6+12+6+10+6+6 = 107

Total lengths for the week = 7089+4218+2935+5918+2935 = 23095.

Total week’s bad lengths = 93+93+235+87+107 = 615

Good length = total lengths – bad lengths = 23095 – 615 = 22480

Therefore, daily availability of the company is the following:

Day planned run-time (A) Down-time (B) availability (A-B/A*100)
Monday 480 minutes 210 minutes 56.25%
Tuesday 480 minutes 184 minutes 61.67%
Wednesday 480 minutes 172 minutes 64.17%
Thursday 480 minutes 144 minutes 70%
Friday 480 minutes 218 minutes 54.58%

Performance = (Total length / Operating Time) / Ideal Run Rate; where operating time is equal to planned run time minus down time (A-B) (Koch, Oskam & Neve 2007). There is an assumption that the values in brackets for real changes in the provided data represent the ideal run rate. Therefore, daily performance is the following:

Day Total Lengths Operating Time Ideal Run Rate Performance
Monday 7089 270 minutes 9 length/minute 2.9172
Tuesday 4218 296 minutes 11 length/minute 1.2955
Wednesday 2935 308 minutes 9 length/minute 1.0588
Thursday 5918 336 minutes 8 length/minute 2.2016
Friday 2935 262 minutes 12 length/minute 0.9335

Quality is given by: Quality = good lengths/total lengths

Day Good Lengths (A) Total Lengths (B) Quality (A/B*100)
Monday 6996 7089 98.69%
Tuesday 4125 4218 97.80%
Wednesday 2700 2935 91.99%
Thursday 5831 5918 98.53%
Friday 2828 2935 96.35%

Note: good lengths are given by total length – bad length.

OEE = Availability * Performance * Quality

Day Availability (A) Performance (P) Quality (Q) OEE (A*P*Q)
Monday 56.25% 291.72% 98.69% 161.94%
Tuesday 61.67% 129.55% 97.80% 78.14%
Wednesday 64.17% 105.88% 91.99% 62.50%
Thursday 70% 220.16% 98.53% 151.85%
Friday 54.58% 93.95% 96.35% 49.41%

From the calculations, it is evident that OEE is not the exact objective; however, it provides the three variables. A company may have low availability, but its effectiveness is outstanding. From the rates of Monday and Tuesday, it is clear that the availability on Monday is lower than that on Tuesday, while Monday's OEE is still higher.

Question Two

Pareto analysis is a straightforward system for prioritizing probable changes by identifying the problems that will be determined by these alterations (Suzuki 2009). By using this method, one can prioritize the single changes that will influence the condition. The study applies the Pareto theory also identified as the "80/20 Rule," which states that 20 percent of causes produce 80 percent of outcomes (Parmenter 2007). This instrument will help to discover the 20 percent of effort that will engender 80 percent of the outcomes caused by responsibility.

The use of Pareto analysis involves following steps. First, classification and recording problems and their causes. Second, scoring every setback and clustering them collectively by their cause. Third, summing up the score for each cluster. Finally, finding an answer to the cause of the problems in cluster bearing the uppermost score (Parmenter 2007). TD machine factory Pareto analysis for the losses would be:

# Problem (Step 1) Cause (Step 2) Score (Step 3)
1 Bad cutting finish on tube knives changed 18
2 Bad finish on dross out solder changed flux set up machine for thin 19.5
3 M/C down bad finish on the tube removed and cleaned knives 7.2
4 Marks on tube pick up on tinned brass 15
5 Lost time during set-up greased rollers 17

Clustering of the cause together and scoring them according to the amount of loss:

Knives removed (causes 1 and 3) = 25.2

Changed flux set up machine for thin (cause 2 and 4) = 34.5

Greased rollers = 17

Pareto Analysis of Loss

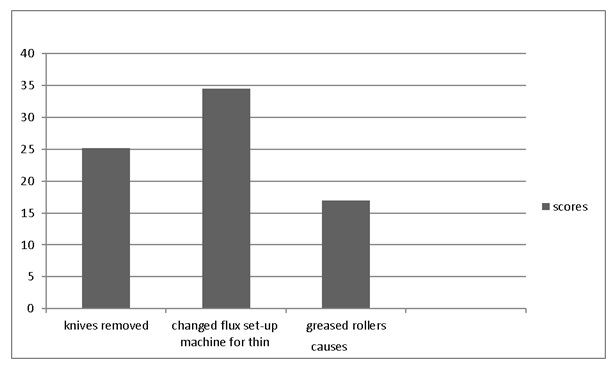
Graph 1. Pareto Analysis of Loss

The Pareto analysis and bar graph above show that the company may achieve great profits and avoid many losses by capitalizing on changing machine setup for thin. Once the cause minimizes, it will be worth observing quality cuts of the tube that is advantageous to the company.

Reference List

Koch, A, Oskam, A, & Neve, J, 2007, Discover the hidden machine: OEE for the production team: the complete OEE user guide. Full fact, Lieshout.

Mohammadi, M, & Mehta, M, 2011, Implementation of a system for monitoring overall equipment effectiveness (OEE) and exploring correlation between OEE and process capability, East Carolina University, Greenville.

Parmenter, D, 2007, Pareto's 80/20 rule for corporate accountants, John Wiley & Sons, Hoboken.

Reyes, JA, 2010, An investigation into some measures of manufacturing performance: overall equipment effectiveness (OEE), process capability (PC), OEE+ and ORE, LAP Lambert Academic Publishing, Köln.

Stamatis, DH, 2010, The OEE primer: understanding overall equipment effectiveness, reliability, and maintainability, CRC Press. Boca Raton.

Suzuki, T, 2009, General equilibrium analysis of production and increasing returns, World Scientific Pub. Co., Singapore.

Coursework: Carbon Fibre Reinforced Polymers

Coursework Example: Carbon Fibre Reinforced Polymers

Abstract

This paper answers two different questions with regards to carbon fibre reinforced polymers. The first question discusses the advantages of carbon fibre reinforced polymers with respect to their mechanical & specific properties in replacing traditional metallics in vehicle body structural applications. In the second question, the paper addresses how high production rates required for many standard classes of vehicles correspond to use of such composite materials. It is done with respect to their processing characteristics. This is important considering that such materials are supplied in the form of pre-preg that must be vacuum bagged and autoclave moulded

Question 1a

Recent proliferation in the use of plastics reinforcement with carbon fibre in load bearing structures of automobiles is a great way to reducing fuel consumption and the weight of the vehicle. Carbon fibre reinforced polymers are not widely used as metals but their use is becoming popular with many manufacturers. The materials have found a wide range of applications in not just the automobiles but also in construction and aerospace. It is majorly due to their specific stiffness and strength, as well as lightness in weight. Carbon fibres also have the other advantages that make their use preferable in automobiles. The materials have a tensile strength, which is six times greater than metals. Such property is important in structures that are exposed to excessive force in the automobiles. Carbon fibre reinforced structures have improved tensional stiffness and high impact properties that make them function better in areas of high impact in a vehicle. In addition, the material has a higher rate of up to 60% of the ultimate tensile strength and it allows the polymers to endure fatigue (Ghassemieh, 2012).

CRFPs also have lower embedded energy when compared to metals. Such property is essential especially where the energy from the automobile engine is absorbed by the metal reducing its force and momentum. The low energy embedded is also important in hot weather conditions where metallic automobile uses air conditions to cool the inside of the automobile. CRFPs are also less noisy during operation and have lower vibration transmission when compared to metals. It is difficult to design metals into some shapes. It may take some time to be achieved and is also very expensive. CRFPs are easier to design into different shapes in relation to the needs and complexity of the design. The materials are more versatile, thus allowing easier, less expensive and faster design into different shapes. Compared to metals, CFRPs are more durable as they have a lower rate of wear and tear compared to metals. They also demonstrate excellent impact and environmental resistance. Thus, the materials are less expensive to maintain (Elmarakbi, 2013).

The anisotropic nature of carbon fibre reinforced polymers is a property that can cause a decreasing of fatigue endurance level of these materials. The anisotropic conductivity of these polymers also affects the unidirectional conductivity of the materials that is a part of the important specific property. To reduce the effect of anisotropy, the designer can exploit the electromagnetic behaviour of the polymer to enhance the automobile performance in highly fatigued areas. The unidirectional carbon fibre reinforced polymers when laminated can act as conductors in parallel E-field and dielectric in perpendicular E-field. Such understanding should help the designer of the material come up with carbon reinforced polymers that meet the fatigue rate of the automobile (Kelly, 2004).

Question 1b

Composite materials are not yet widely used in the automobile industry. However, there are many opportunities where advanced composites can be put into commercial use in automobile. For instance, in specialty vehicles that require small quantity of composite materials, they are already used to demonstrate the capabilities of CFRP. The composite industry is investing in coming up with improved processing that includes moulding of the plastics through conventional E-glass and mid-level performance resins. The thermoset and thermoplastic automobiles account for 50% composite market. The relatively low cost of fibre and faster cycle time will ensure easier integration. CFRP can be processed in different methods, including desizing and etching in the prepreg conditions. Open mold approach can be used to prepare the composite samples before the application of fibre and resins on the material. The designer can then fix the carbon fibres in a unidirectional arrangement so that to keep parallel fibres in a state of tension (Mallick, 2007). The processing of prepreg composites is undertaken in consideration of the required volumes. It is among the impediments to the widespread adoption of composites in the automobile industry especially where mass production is needed. The cost of the raw material and lack of suitable manufacturing processes impedes on the use of that material in the production of automobiles. The production engineers are left with the responsibility of making a choice in relation to the required rate of production, if they are going to use CFRP. An average truck within a manufacturing plant will require up to 20,000 units per year, which makes their handling another task. For small cars, the figure is even higher in the ranges of 500,000 units. In addition, CFRP in prepreg conditions are subject to the other conditions, such as scrap production, cycle time and tooling costs that many automobile producers might not be willing to meet (McWilliams, 2007).

The tools used in the composite production are cheaper when compared to those used in metal forming due to single moulding in CFRP. On the other hand, metals require five to six different tools in single component line. However, such simple saving in tool costs can only be realised at low production volumes in CFRP processing but not in higher volumes that require a part of dominance. The processing of CFRP at low volumes can only be maximized in short fibre reinforced thermoplastic injection and also in bulk processing processes (Elmarakbi, 2013). However, it has not been found to be applicable in structural building, not to mention automobile building. The development of long fibre reinforced thermoplastic will bring CFRP closer to a structural fibre. The injection moulding is advantageous as it has short cycle time and produces little scrap. Very few processes are available for medium composite material processing, including the sheet and compression moulding. They have also been automated and used in vehicles with cycle times ranging a span of few minutes (Kelly, 2004).

Question 2

The carbon fibre reinforced polymers have been touted as the answer to the issue of weight and strength in automobile manufacturing. However, in the recent past niche vehicle manufactures have been moving away from CFRP due to the counter elements that make their use of CFRP not only improbable but also costly. The use of CFRP is not so much hinged on automated processes as its competing aluminium material. The low volume production and high priced vehicles mean that using hand-built tools to build them will increase tremendously the cost of production. It will push further the prices of the car. It might not be good for customers of such specialized cars (Society of Automotive Engineers, 2014).

Labour and time considerations are essential factors in the use of CFRP materials in niche vehicle productions as it impacts the production speed. The process also impedes on the advantage of weight-saving potential as soon as high volume construction technique is used. As such, the use of CFRP materials in low volume and niche production of vehicles is rather a factor of the unavailability of the necessary technology and labour than the advantage of the other materials. It implies that a better technology in the future might experience the coming back of composite materials in production of niche vehicles (McWilliams, 2007).

Low volume specialized cars also have special characteristics that cannot be delivered through the use of CFRP material in the production. For instance, the heat-treatment technology that uses aluminium improves the vehicle’s deformability properties and improves its crash absorption, which is something that still appeals to the consumers of such products. Aluminium is also able to deliver similar advantages, such as low weight and better control of inertia, hence better handling by the user among the other benefits.

Reference List

Elmarakbi, A. (2013). Advanced composite materials for automotive applications: structural integrity and crashworthiness. John Wiley & Sons: New York.

Ghassemieh, E. (2012). Materials in automotive application, state of the art and prospects, University of Sheffield, University of Sheffield Press. Available at .

Kelly, G. (2004). ‘Joining of carbon fibre reinforced plastics for automobile applications’, Polymer Science and Engineering, 12(5): 19-45.

Mallick, P. (2007). Fiber-reinforced composite materials, manufacturing, and design, Taylor & Francis, New York. Available at .

McWilliams, A. (2007). Advanced materials, lightweight materials in transportation report’, Report Code: AVM056A.

Society of Automotive Engineers. (2014) ‘Ferrari prefers aluminum over carbon fiber’, SAE International Ltd. Available at