Manufacturing a product is a difficult practice. Due to lack of metrics and plans, it is quite easy to lose direction and have the industry managed by the production. Overall equipment effectiveness (OEE) is a criterion that combines various manufacturing issues and figures to provide information concerning the progression. Through a predictable process of combining the essential data, OEE gives definite process information. All staff members can utilize the facts to comprehend the modern shape of the manufacturing process. By having a programed structure of the impact of machine accessibility, performance, and eminence, OEE provides an outline to trace fundamental issues and their origins. Moreover, OEE provides a structure for improvements in the manufacturing process (Mohammadi & Mehta 2011). This paper calculates the availability, performance, quality, and OEE of the company that manufactures radiators and heat exchangers. In addition, it will analyze losses using Pareto technique giving recommendations for improvements.
Question One
OEE takes into consideration three factors: availability, performance, and quality (Reyes 2010). It is calculated using the following formula:
OEE = Availability x Performance x Quality, where availability is the machine used for planned manufacture.
At the most crucial point of the process operation, worth for the ultimate user is created. When a process stops, it creates an expenditure with no linked charge. It can be explained by mechanical failure, operator issues, raw materials, and machine operation. Comparing planned run time to actual run time, the availability constituent of OEE allows to calculate the lost production due to downtime (Mohammadi & Mehta 2011).
Performance is calculated by the amount of waste produced through operation at less than most favorable speed. By comparing the real cycle time and perfect cycle time, it is possible to calculate the amount of production lost through cycles that did not attract the perfect cycle time (Reyes 2010). On the other hand, quality focuses on determining the time spent on production of a good that does not meet quality requirements. Through comparison of the amount of good to reject parts, the percent of the time truly adding value by producing a good product is exposed (Stamatis 2010).
Using the TD tube machine data, one can derive the following:
OEE = Availability * Performance * Quality
Availability = planned run-time – down-time/planned run-time
Planned run-time is 8 hours or 480 minutes (from 8 am to 4 pm, there are 8 hours multiplied by 60 minutes) per day from Monday to Friday.
Down time = minor stops + startup losses + breakdowns + reel changes + materials + breaks + set ups
Monday down time = 5 + 40 + 51 + 25 + 45 + 18 + 26 = 210
Tuesday down time = 5 + 66 + 21 + 40 + 20 +32 = 184
Wednesday down time = 60 + 29 + 50 + 14 + 19 = 172
Thursday down time = 1 + 48 + 16 + 30 + 20 + 29 = 14
Friday down time = 1 + 70 + 19 + 75 + 14 + 39 = 218
Good lengths = total lengths – rejected/bad lengths.
Monday total lengths = 1347 + 1283 + 1588 + 1588 + 1283 = 7089.
Monday bad lengths = 25 + 24 + 10 + 25 + 5 + 4 = 93
Tuesday total lengths = 1283 + 1588 + 1347 = 4218.
Tuesday bad lengths = 5+15+9+4+6+40+6+8 = 93
Wednesday total lengths = 1347=1588 = 2935.
Wednesday bad lengths = 35+20+10+6+22+10+15+20+6+15+20+10+6+25+15 = 235
Thursday total length = 1347+1941+1283+1347 = 5918.
Thursday bad lengths = 6+10+6+10+6+6+6+8+29 = 87
Friday total lengths = 1347+1588 = 2935.
Friday bad lengths = 40+15+6+6+12+6+10+6+6 = 107
Total lengths for the week = 7089+4218+2935+5918+2935 = 23095.
Total week’s bad lengths = 93+93+235+87+107 = 615
Good length = total lengths – bad lengths = 23095 – 615 = 22480
Therefore, daily availability of the company is the following:
| Day | planned run-time (A) | Down-time (B) | availability (A-B/A*100) |
| Monday | 480 minutes | 210 minutes | 56.25% |
| Tuesday | 480 minutes | 184 minutes | 61.67% |
| Wednesday | 480 minutes | 172 minutes | 64.17% |
| Thursday | 480 minutes | 144 minutes | 70% |
| Friday | 480 minutes | 218 minutes | 54.58% |
Performance = (Total length / Operating Time) / Ideal Run Rate; where operating time is equal to planned run time minus down time (A-B) (Koch, Oskam & Neve 2007). There is an assumption that the values in brackets for real changes in the provided data represent the ideal run rate. Therefore, daily performance is the following:
| Day | Total Lengths | Operating Time | Ideal Run Rate | Performance |
| Monday | 7089 | 270 minutes | 9 length/minute | 2.9172 |
| Tuesday | 4218 | 296 minutes | 11 length/minute | 1.2955 |
| Wednesday | 2935 | 308 minutes | 9 length/minute | 1.0588 |
| Thursday | 5918 | 336 minutes | 8 length/minute | 2.2016 |
| Friday | 2935 | 262 minutes | 12 length/minute | 0.9335 |
Quality is given by: Quality = good lengths/total lengths
| Day | Good Lengths (A) | Total Lengths (B) | Quality (A/B*100) |
| Monday | 6996 | 7089 | 98.69% |
| Tuesday | 4125 | 4218 | 97.80% |
| Wednesday | 2700 | 2935 | 91.99% |
| Thursday | 5831 | 5918 | 98.53% |
| Friday | 2828 | 2935 | 96.35% |
Note: good lengths are given by total length – bad length.
OEE = Availability * Performance * Quality
| Day | Availability (A) | Performance (P) | Quality (Q) | OEE (A*P*Q) |
| Monday | 56.25% | 291.72% | 98.69% | 161.94% |
| Tuesday | 61.67% | 129.55% | 97.80% | 78.14% |
| Wednesday | 64.17% | 105.88% | 91.99% | 62.50% |
| Thursday | 70% | 220.16% | 98.53% | 151.85% |
| Friday | 54.58% | 93.95% | 96.35% | 49.41% |
From the calculations, it is evident that OEE is not the exact objective; however, it provides the three variables. A company may have low availability, but its effectiveness is outstanding. From the rates of Monday and Tuesday, it is clear that the availability on Monday is lower than that on Tuesday, while Monday's OEE is still higher.
Question Two
Pareto analysis is a straightforward system for prioritizing probable changes by identifying the problems that will be determined by these alterations (Suzuki 2009). By using this method, one can prioritize the single changes that will influence the condition. The study applies the Pareto theory also identified as the "80/20 Rule," which states that 20 percent of causes produce 80 percent of outcomes (Parmenter 2007). This instrument will help to discover the 20 percent of effort that will engender 80 percent of the outcomes caused by responsibility.
The use of Pareto analysis involves following steps. First, classification and recording problems and their causes. Second, scoring every setback and clustering them collectively by their cause. Third, summing up the score for each cluster. Finally, finding an answer to the cause of the problems in cluster bearing the uppermost score (Parmenter 2007). TD machine factory Pareto analysis for the losses would be:
| # | Problem (Step 1) | Cause (Step 2) | Score (Step 3) |
| 1 | Bad cutting finish on tube | knives changed | 18 |
| 2 | Bad finish on dross out solder | changed flux set up machine for thin | 19.5 |
| 3 | M/C down bad finish on the tube | removed and cleaned knives | 7.2 |
| 4 | Marks on tube | pick up on tinned brass | 15 |
| 5 | Lost time during set-up | greased rollers | 17 |
Clustering of the cause together and scoring them according to the amount of loss:
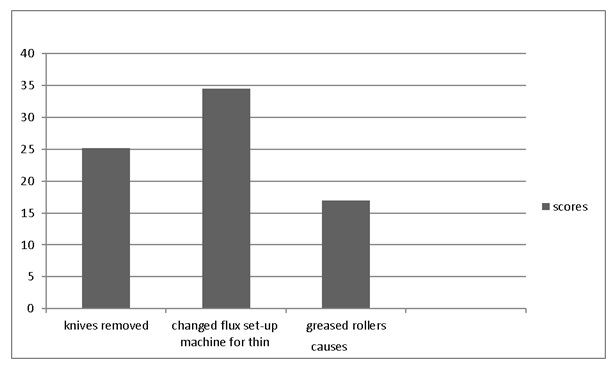
Knives removed (causes 1 and 3) = 25.2
Changed flux set up machine for thin (cause 2 and 4) = 34.5
Greased rollers = 17

Graph 1. Pareto Analysis of Loss
The Pareto analysis and bar graph above show that the company may achieve great profits and avoid many losses by capitalizing on changing machine setup for thin. Once the cause minimizes, it will be worth observing quality cuts of the tube that is advantageous to the company.
Reference List
Koch, A, Oskam, A, & Neve, J, 2007, Discover the hidden machine: OEE for the production team: the complete OEE user guide. Full fact, Lieshout.
Mohammadi, M, & Mehta, M, 2011, Implementation of a system for monitoring overall equipment effectiveness (OEE) and exploring correlation between OEE and process capability, East Carolina University, Greenville.
Parmenter, D, 2007, Pareto's 80/20 rule for corporate accountants, John Wiley & Sons, Hoboken.
Reyes, JA, 2010, An investigation into some measures of manufacturing performance: overall equipment effectiveness (OEE), process capability (PC), OEE+ and ORE, LAP Lambert Academic Publishing, Köln.
Stamatis, DH, 2010, The OEE primer: understanding overall equipment effectiveness, reliability, and maintainability, CRC Press. Boca Raton.
Suzuki, T, 2009, General equilibrium analysis of production and increasing returns, World Scientific Pub. Co., Singapore.
Comments on “Coursework: Overall equipment effectiveness (OEE)”